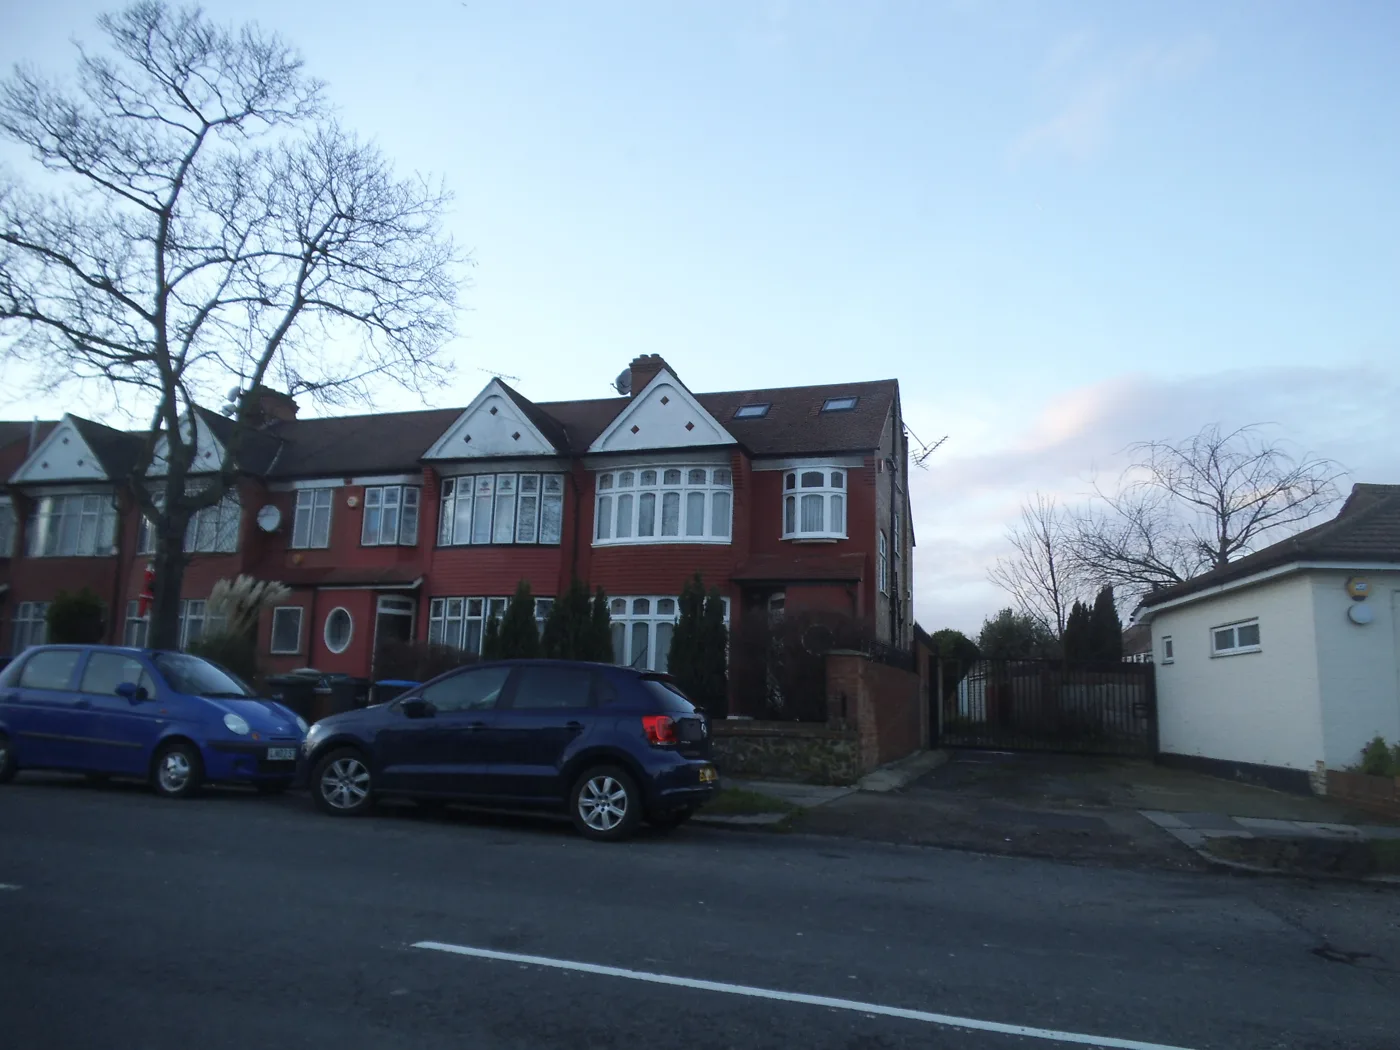

Enfield's average reached £470,988 in July, up £2,765 on the year. Just 681 homes sold from January to May, the fewest in any year since the index began.
Enfield’s house prices went up in the year to July. Hardly anybody moved.
681 homes changed hands in the borough between January and May, according to HM Land Registry. That is the lowest total for those five months in any year since the index began in 1995. It is lower than 2020, when the housing market was legally shut for part of the spring, and lower than 2009, in the trough after the financial crisis.
(HM Land Registry, UK House Price Index, July 2026)
The five-month count, year by year
| Year | Sales, January to May |
|---|---|
| 2026 | 681 |
| 2025 | 1,162 |
| 2024 | 831 |
| 2023 | 800 |
| 2020 | 715 |
| 2009 | 735 |
Two honest caveats before anyone reads too much into the drop.
The first is that 2025 is a distorted comparison. The stamp duty thresholds changed on 1 April 2025, and Enfield registered 508 sales in March 2025 alone as buyers rushed to complete, then 88 in April. That one month accounts for most of the gap. But 681 is still well below the 831 of 2024 and the 800 of 2023, neither of which had a deadline in them.
The second is that the figures are provisional. The Land Registry publishes no sales count for the two most recent months because the records are incomplete, which is why May is the latest month available, and totals for recent months can move as registrations come in.
Prices went the other way
The average Enfield home was worth £470,988 in July. That is £2,765, or 0.6%, more than a year earlier.
That was enough to make Enfield one of the better performers in London. Only 12 of London’s 33 areas saw prices rise over the year. 21 fell. London as a whole was down 3.3% to £550,037, while England rose 1.1% to £293,479. Enfield ranked 10th of the 33 London areas, and 192nd of England’s 295 local authority districts, where 85 areas fell.
How the neighbours did over the same twelve months:
| Area | Average, July 2026 | Annual change |
|---|---|---|
| Waltham Forest | £529,102 | +2.8% |
| Broxbourne | £411,689 | +2.5% |
| Hertsmere | £548,704 | +1.3% |
| Haringey | £638,690 | +1.0% |
| Enfield | £470,988 | +0.6% |
| Epping Forest | £525,719 | -1.6% |
| Barnet | £600,560 | -4.9% |
Barnet is the one to note. Enfield’s western neighbour lost nearly 5% of its average value over the year.
Houses up, flats down, again
The borough average covers four very different markets, and in the year to July every kind of house rose while flats fell:
| Property type | Average, July 2026 | Annual change |
|---|---|---|
| Detached | £1,243,138 | +1.8% |
| Semi-detached | £714,519 | +1.6% |
| Terraced | £496,816 | +1.7% |
| Flat or maisonette | £298,486 | -1.7% |
| First-time buyer | £398,455 | +0.4% |
That is a change from the June release, where detached homes were falling and terraces were doing the lifting. On the July figures the three house types moved together, within a fifth of a percentage point of each other, and flats were the only faller.
The month itself was down, and June has been revised up
Two things sit behind the annual rise, and both cut against it.
Prices fell 0.8% during July, the steepest one-month fall in Enfield since November 2025.
And the June figure has moved. When we reported the June release on 21 August the average was £471,019, an annual rise of 0.3%. The Land Registry has since revised June up to £474,806, an annual rise of 1.1%. So June was stronger than first published, and July gives most of that back.
Revisions of this size are normal in the first months after a release, as more completed sales are registered. It is worth remembering whenever a single month’s figure is quoted at you.
Enfield still has not got back to where it was. The borough’s highest recorded average was £486,208 in December 2022. July is £15,220, or 3.1%, below that, before any allowance for inflation.
One technical point that matters when you compare this with an estate agent’s figure: the UK House Price Index average is a mean, not a median. A handful of large sales in Hadley Wood or Winchmore Hill pull it upward in a way a median would not.
What it means for you
If you are selling, the market is thin rather than weak. Prices are roughly where they were a year ago, but the number of buyers completing is the lowest in three decades of records. Expect it to take time.
If you are buying a flat, you are in the only part of the Enfield market that is still falling, down 1.7% over the year to an average of £298,486.
If you are a first-time buyer, the average first-time-buyer purchase in the borough was £398,455 in July, up 0.4% over the year.
If you want the detail by area, our Enfield house prices page breaks the borough down by postcode district, from Winchmore Hill to Upper Edmonton, and explains why the single borough average hides so much. If you are working out what a move would cost you month to month, the Enfield council tax bands page has this year’s charges for every band.
Sources
Have your say